
Abstract:
Based on analyzing and defining ofthe meanings and fundamental characteristics ofresource–based cities,The paper mainly expoundsthe mechanism and counter measures for sustain-able development of resource-based cities,andpoints out that the cities should take hold of the lifeperiod of minng industries,realize the continua-tion of resources and industries for their economicdevelopment.Then establish the resource-basedcities complex system of sustainable developmentof evaluation model.The ecological footprint analy-sis method is used to study the change of ecologicalfootprint in typical resource-based cities for under-standing the sustainable development abilityduring the period of economical transition.
Keywords:ecological footprint,resource-basedcities,ecological carrying capacity,sustainable de-velopment,Evaluation model
Ecological Footprint provides an effective tool toquantify the city or regional sustainable develop-ment,as a measure of the degree of regional sus-tainable development evaluation method of biologi-cal physics,has been widely used in global,nation-al,regional,urban,tourism and even various levelsof household consumption.
In the early 1990s,William Wackernagel which is aCanadian professor Rees ecological economist andstudents put forward and to development and de-velop gradually mature.Since it was proposed inthe world provoked strong response,the interna-tional research has been mainly carried out threespatial scales:the global scale research,nationalscale research,regional and urban scale research.Ecological footprint concept introduced in 1999and ecological footprint indicators also launchedthe applied research,the domestic research startedfrom the two levels.①The basic theory of the eco-logical footprint of the system introduced.YangKaizhong,LiLifeng etc introduced this theory of theconcept,theoretical framework,index system andcalculation method.Wang Shuhua,Mao HanYingetc introduced the ecological footprint of recent de-
in research at home and abroad.②Ecological foot-print model will be applied to different regionalscale,its research applications ranging from na-tional scale to the provincial scale,city scaledomain,and further extended to the county scale;from the regional ecological footprint to a personalecological footprint;Regional time series for a yearfrom the static study to the dynamics of manyyears,quantitatively assessed of regional sustain-able development[1~3].
Resource-based cities are special groups in theurban system.They are industrial cities that mineand process local non-renewable natural resourcesas a leading industry.Resource-based cities appearmostly in the 20th century to improve the state’s 50industrial system and to establish self-sufficient Tothe output of non-renewable resources develop-ment and construction of a number of cities.Re-source-based cities in the modernization drive ahuge role to play for China’s economic developmentresources to provide a favorable guarantee.Howev-er,the resource-based cities in the development ofsocialist market economy,there are inevitablysingle industrial structure,urban functions weak,slow economic growth,local market dull,resourcedepletion,large numbers of workers of state-ownedenterprises laid off the city facing a transition and aseries of urgent problems.Sustainable develop-ment of resource-based cities faces serious chal-lenges.So far the depletion of resources cities havebecome a worldwide topic,predatory exploitation ofresources model incrcased the ecological footprintof the city itself,the city restrict the healthy direc-tion.For most of the industrial city,the ecologicalfootprint an important part of the composition ofconsumption not the city itself[4,5].
In this paper,Fuxin,Huainan,Hebi,Wu an fourtypical resource-based cities,for example,evalua-tion of the ecological footprint model,based on thestructure of their ecological footprint and ecologicalcapacity of the structure is analyzed,highlightingthe exploitation of resources of the city can Sustainable development.
1.Ecological footprint evaluation model
Any known of the ecological footprint of popu-lation,is the production of these population of allresources consumption and absorb these popula-tion all the waste generated total needed ecologicalproductive(including land and water).[6]Ecologicalfootprint can deeply reflects human activities onthe ecological environment influence,the size of theinfluence degree directly determines the sustain-able development of regional ecological environ-ment.Ecological footprint model is based on theconsumption of human tracking its own resourcesand the amount of waste emissions,and find theirproduction areas and consumptive area categories,and most of the resource flows and waste flows canbe converted to the corresponding biologically pro-ductive land or based on the theory of water area.By building different types of productive landequivalent factor,the different types of productiveland area is comparable to the same uniform sizecalculation,and then estimate the population tomaintain a certain area of natural resource con-sumption and waste required to dissolve the eco-logical production Space surface.Human con-sumption project is divided into biological resourc-es,water resources,energy and construction landin 4 parts,and these projects occupy farmland,forest land,meadow,fossil energy,building landsand waters six ecosystem.Calculate the ecologicalfootprint of various ecosystems and the ecologicalcarrying capacity,on the basis of ecological surplus(deficit)state.Ecological footprint,ecological carry-ing capacity and ecological surplus(deficit)calcu-lated as follows[7]:
(1)Ecological footprint calculation
The ecological footprint of any given populationis its occupation of the resources consumed for theproduction and use of existing technologies andservices,its assimilation of the biological produc-tion of waste generated total area of land or sea.Itscomputation formula is:
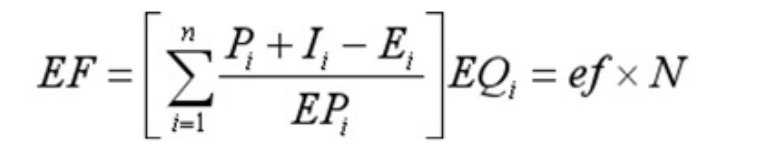
Among them:i for consumer goods type;EF forgeneral ecological footprint;Pi for i kind of com-modity production;li for i kind of goods imports;Eifor i kind of goods exports;EPifor ikind of the aver-age production ability of consumer goods;EQi for i
of equivalent of factor of consumer goods;ef for percapita ecological footprint;N for the total popula-tion.
(2)Ecological carrying capacity
In the ecological carrying capacity or the biolog-ical capacity of the calculation,due to differentcountries or regions with different resource endow-ments,not only per unit area of
cultivated land,grassland,forest land,construc-tion land,water and other ecological productionvary widely,but per unit area of the same type of bi-ological Production area is also a great difference inecological productivity.Therefore,different coun-tries and regions in the actual production of similarcreatures land area is not the direct contrast,needto adjust the different types ofarea.Different coun-tries or regions of the class of biologically produc-tive area represented by the local production andaverage yield difference between the world can”yield factor”means.A certain country or region ofland yield factor is its kind in the world averageproductivity and the ratio of average productivity ofland,such as arable land yield factor is taken as1.66,indicating that the biological productivity ofarable land is cultivated the world average level ofoutput 1.66 times.Existing arable land,pasture,forest,construction,water and other physicalspace area multiplied by the corresponding localequilibrium factor and yield factor,you can get withthe world average production area of the world’s av-erage ecological carrying capacity of ecologicalspace.At the same time for consideration of pru-dence,should be deducted in the calculation of eco-logical carrying capacity of 12%of the biodiversityconservation area.The formula is:
(3)Ecological surplus computing
Ecological carrying capacity of an area smallerthan the ecological footprint,ecological deficit,minus the size of ecological footprint ecological car-rying capacity is equal to the difference;ecologicalcarrying capacity greater than the ecological foot-print,the ecological surplus is generated,the sizeof the ecological carrying capacity is equal to Minusthe ecological footprint of the remainder.Ecologicaldeficit that the region’s human load exceeds theecological capacity,to meet the standard of living ofits population under the current consumerdemand,the region or imported from outside theregion lack the resources to balance the ecologicalfootprint,either by depletion of natural capital toFlow of income to make up for lack of supply.Thesetwo kinds of circumstances that regional develop-ment mode is a relative an unsustainable position,its unsustainable level measured with ecologicaldeficit.In contrast,ecological surplus that the eco-logical capacity of the region to support its humanload,the area’s revenue stream is greater than nat-ural capital consumption demand of populationflow,the total area of natural capital may be in-creased,the ecological capacity is expected toexpand in the region With the relative sustainabilityof consumption patterns,sustainable levels mea-sured with the ecological surplus.
The formula is:
ES/ED=EC-EF
Among them:ES for ecological surplus;ED for eco-logical deficit.
If the regional ecosystem to withstand a total areaof productive resource consumption and waste ofthe consumptive,the ecological surplus,the ecolog-ical environment will be able to continue to thehealthy development;On the contrary,for the eco-logical deficit,the ecological environment within theregion in a relatively unsustainable;When humanactivities on the ecological environment can bearmore than its maximum limit,the ecological envi-ronment will be close to collapse.
2.The ecological footprint analysis of four typicalcities
2.1 Fuxin,liaoning province ecological footprintanalysis
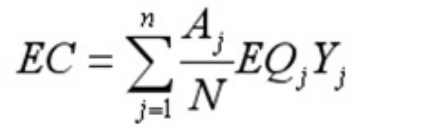
Through 1996 and 2004in Fuxin city of biologi-cal resources account,energy account and resourc-es such as the output account calculated the eco-logical footprint,combined with biological produc-tion from the land area,Fuxin 1996 and 2004,theecological footprint summary(See table 1 and table2).
Table 1 Fuxin ecological footprint calculation sum-mary table in1996
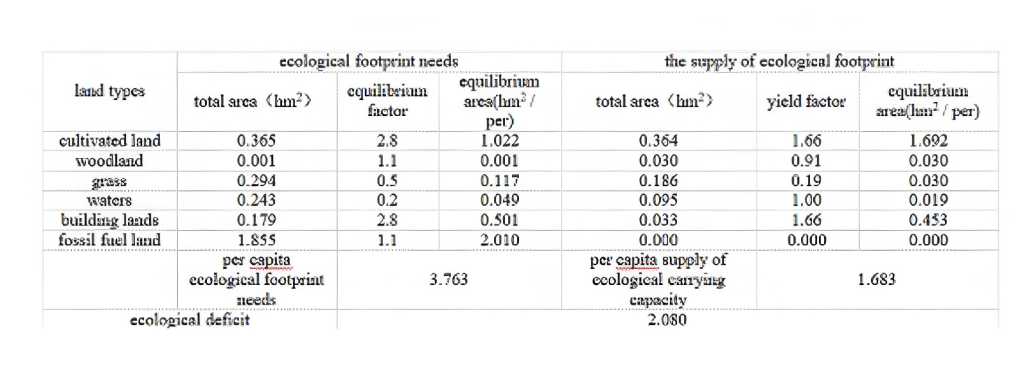
Table2 Fuxin 2001 ecological footprint calculationsummary table
From the above two tables show,Fuxin City,in1996 the per capita ecological footprint 3.763hm2,the per capita ecological capacity was 1.683 hm2,per capita ecological deficit of 2.080 hm2;FuxinCity in 2001 per capita ecological footprint is 3.982hm2,per capita ecological carrying 1.876hm2,percapita ecological deficit of 2.331 hm2.Ecologicaldeficit from 1996 to 2001 increased from the 2.080hm22.331 hm2,an increase of 0.251hm2,still un-sustainable.The existence of ecological deficit thatconsumer demand in Fuxin City’s population ex-ceeds the regenerative capacity of natural ecosys-tems,reflecting the strength ofits production lifethan the carrying capacity of the ecosystem,the re-gional eco-system is human over-exploitation andunder pressure.Show the gradual deterioration ofecological environment in the trend of sustainabledevelopment in Fuxin City,is not optimistic.
2.2 Huainan,Anhui province ecological footprintanalysis
Through to the 2004 various biological resourcesaccount,energy account and resources such as theecological footprint output account calculated,combined 2004 biological production from the landarea,in 2002 the ecological footprint summary,(See table 3).
Table 3 Huainan ecological footprint calculationsummary table in1996
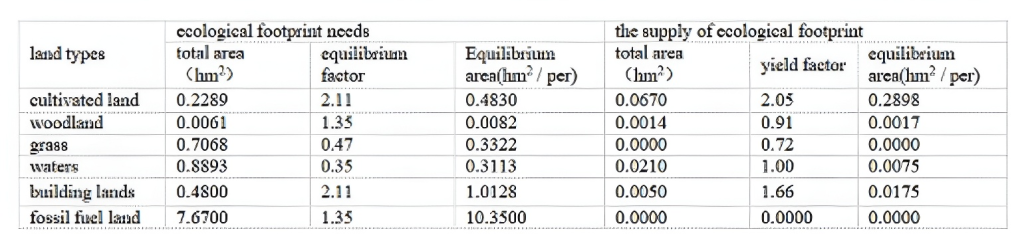
Table 3 shows that in 2004,the ecological footprintof Huainan City 12.4975 hm2/per ecological carry-ing capacity is 0.2785 hm2/per and ecologicaldeficit 12.2190 hm2/per its ecological footprint is45 times of ecological carrying capacity.The emer-gence of ecological deficit that can not maintain theecosystem of Huainan City,urban ecological con-sumption,”the high demand,low supply”thedemand of ecological footprint will further increase;Ecological footprint growth in demand,especially fossil fuels,demand growth of ecological footprintand biological production of forest land,especially aserious shortage of supply caused by the increasein ecological deficit.Therefore,should the local con-sumption of natural capital through the stock tomake up for lack of ecological capacity.
Huainan City in 2002 from the per capita ecolog-ical footprint demand structure,the demand forfossil fuels,land space of the total demand forspace,82.8%,while the main consumer of fossilfuels is coal land,accounting for energy demandfootprint of 54.8%,while the output of the coal re-sources Volume is accounted for 61.7%of the totalcoal.This kind of consumption and output ofcoal-based structure is an important ecologicalcauses environmental pollution.This shows Huain-an ecological deficit is caused by over-exploitationof natural resources,and on the other hand showsa large number of output constraints of resourcessustainable development of resource-based cities.In 2004 from the structure of ecological carrying ca-pacity,the land that 0.2898 occupies reach ecologi-cal space hm2/per,90.56%total supply area.Inaddition,the reserved but did not use 12%of the bi-ological diversity of ecological land space,indicatingthat the supply of the region,a single type of ecolog-ical space.A lot of land resources for the transfor-mation of resource-based city offers plenty of space,we should say this is the diversity in Huainan City,the advantages of industry.
2.3 Hebi,Henan province ecological footprint analy-sis
Hebi City in 2002 through a variety of biological re-sources,energy consumption and resource outputcalculation of ecological footprint,combined withbiologically productive land area in 2002,Hebi Cityin 2002 by the following summary of ecological foot-print,see table 4.
Table 4 Hebi city 2002 summary table ecologicalfootprint calculation
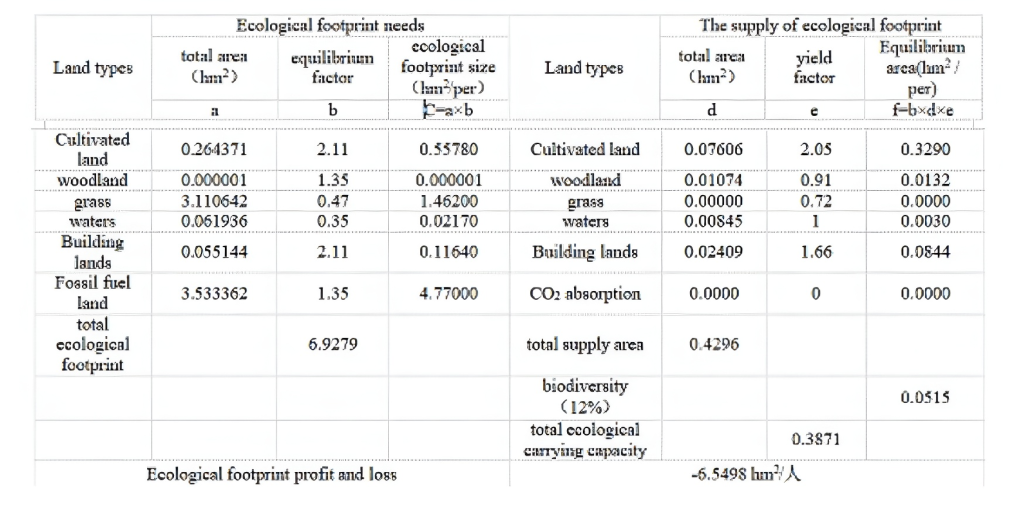
As can be seen from Table 4,2002,Hebi ecologi-cal footprint size 6.9279hm2/per and ecologicalcarrying capacity 0.3781hm2/per and ecologicaldeficit 6.5498hm2/per,its ecological footprint isthe ecological carrying capacity of 17.3 times.Theemergence of ecological deficit,the authors showthat the influence of ecological economic systemover the threshold value of ecological carrying ca-pacity.From the above calculation of ecologicalfootprint can be found,is the output type Hebi city,foreign trade has been the main output of mineralresources,it is only through the consumption oflocal natural capital stock to make up for lack ofecological capacity.Hebi City is not currently in astate of sustainable development
Hebi City,from 2002 per capita ecological foot-print demand structure,the demand for fossil fuels,land space accounted for 68.9%of total demand forspace,while the main consumer of fossil fuels iscoal land,accounting for energy demand footprintof 73.8%,while the resource output The amount ofcoal and coal accounted is 74.6%of the total.Kindsof consumption and output of coal-based structure,increasing the ecological deficit,pollution,ecologi-cal environment is an important reason.On the onehand that the ecological deficit in Hebi City,iscaused by over-exploitation of natural resources,onthe other reflects the large number of output con-straints of resources and sustainable developmentof resource-based cities.
Hebi City from 2002 shows the structure of eco-logical carrying capacity,ecological space in whichpossession of land 0.3290hm2/per,accounting for76.6%of the total supply area.Plus the obligate butdid not use the biodiversity 12%of ecological landspace,this area supply a single type of ecologicalspace.The amount of land resources for the trans-formation of resource-based cities provides amplespace should be said that the industry is to HebiCity,the advantages of diversification.
2.4 Wu’an Hebei province ecological footprint analy-sis
Wu’an the ecological footprint consists of twoparts,both the consumption of biological resourcesand energy consumption.As a landlocked,Wu’aneconomic unit,the volume of trade is relativelysmall,and some import and export can be offset tosome extent,on the calculation of ecological foot-print is very small,therefore,this article does notadjust the import and export trade.Consumption ofbiological resources can be transformed into arableland,grassland,water and woodland;energy consumption can be converted to fossil energy and con-struction sites.Wu’an in 2005 per capita ecologicalfootprint demand structure,only the fossil energydemand for space and farmland accounted for97.31%total demand for space.Among them,thedemand for fossil energy in space accounted for55.33%total demand for space,while the main con-sumer of fossil fuels is the land of raw coal andcoke,accounting for 83.54%of energy demand foot-print.This kind of consumption and output ofcoal-basedstructure,an increase of per capita eco-logical footprint demand Wu’an is the main reasonfor pollution of ecological environment.The totaldemand for space land 41.98%,the main consumerdemand for pork accounts for the space of biologicalresources,71.21%.The reason why so much porkproduction is mainly the adjustment of industrialstructure in recent years Wu’an and marketdemand,and to some extent increase the demandfor arable land.
Wu’an city ecological footprint and ecologicalcarrying capacity calculation results see table 5.Table 5,2005 Wu’An City ecological footprint calcu-lation summary table
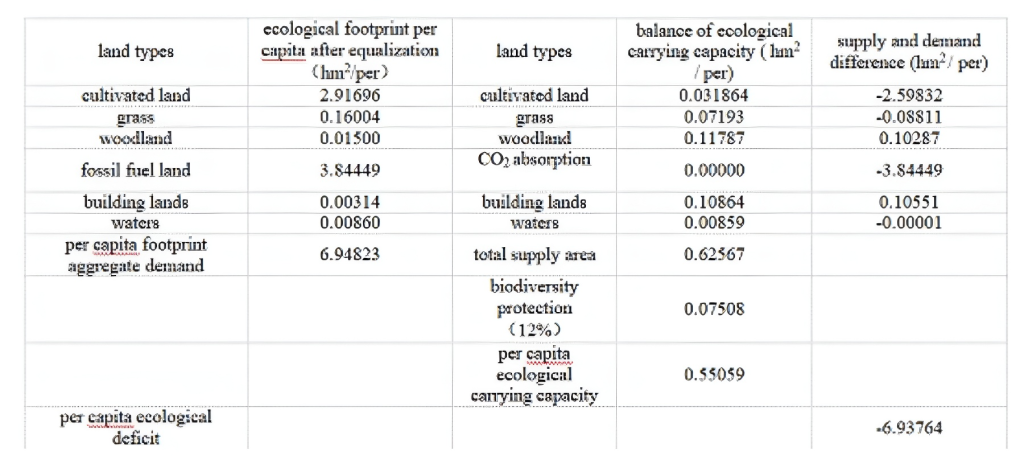
The results showed that Wu’an ecological foot-print much larger than the ecological carrying ca-paciy,is about a 11 times,with 12%of net biodi-versity conservation supply area,the per capta eco-logical deficit Wu’an 6.39764hm2/per,far higherthan the national 0.8829hm2 /and Hebei1.0676hm2/per.Ecological deficit is the largestsource of fossil energy and land,respectively,3.84449 hm2/and 2.59832 hm2/per that fossilenergy and the supply of land is far less thandemand;followed by the grass.Ecological surplusmainly reflected in the forest and construction land,water demand and supply of basic ecological bal-ance.Wu’an high dependence on energy is causedmainly due to the serious ecological deficit,the datashow that the area of human needs for natural re-sources far beyond its ability to supply is not con-ducive to the sustainable development of the region.The structure of irrational use of resources will in-period of resource depletion within the region.
3.The sustainable development of resources citycountermeasures
3.1 The resource-based cities sustainable resourcesway
Exploration of resources,scientific and rationaldevelopment and utilization of macro regulationand guidance,such as the scientific concept of de-velopment has always been guided to the produc-tion of resource-based enterprises to guide the de-velopment and operation of some of the ideologicaltendency with a certain resource policies and regu-lations.Guide reasonable resource-based enter-prises and legal resources exploration,exploitationand vigorously promote resource-saving and envi-ronment-friendly concept of the production of re-sources to further strengthen the development andutilization of mineral resources to further clarify therestructuring of prospecting and mning rights ofthe relevant provisions of the management of im-portant minerals Measures to strengthen the Gov-ernment policy guidance and regulation.
Mining the market order of norms,smooth andorderly environment directly affect the mining of or-dered operation and healthy development.We needto further strengthen the “Mineral Resources Law”and other laws and regulations related to the imple-mentation and enforcement,and thoroughly imple-ment the protection and conservation of mineral re-sources,and resolutely put an end to the waste ofresources and ecological environment in furtherdamage and deterioration,monitoring re-source-based enterprises,”three wastes””Third rate”and other indicators of completion,strengthenmanagement,improve utilization of mineral re-sources.
3.2 The sustainable development of resources cityenvironmental way
Vigorously implement the strategy of the greenmining town,set the environment is also a new con-cept of productivity,protect the ecological environ-ment of resource-based cities,aimed at strengthen-ing the resource-based cities of mineral resourcesdevelopment and environmental protection,re-source development of the whole process of imple-mentation of environmental monitoring and man-agement.The specific measures are:First,to devel-op mining environmental regulations to protectmining environment;Second,adherence to the”who develops protection,those who created pollu-tion,who restore quasi-destruction”principle,development of ecological protection and restorationschemes,fostering market-based instruments ofenvironmental protection Industries,and encour-age the development of mineral resources to pro-mote waste minimization and clean productiontechnologies;Third,development of mineral re-sources development and implementation of envi-ronmental compensation fee,land reclamation de-posit policies to reduce the environmental costs ofmineral resources development;Fourth,activelypromote the mine “three wastes”resources andmineral mining impacts on the surrounding envi-ronment,sound work;Fifth,from mineral explora-tion,development,utilization,environmental pro-tection the whole process of implementation of envi-ronmental management,development and utiliza-tion of mineral resources to minimize damage to theenvironment.
Develop green mining,mining cities to achievecircular economy is an important way to sustain-able development.Take the “reduce,reuse,recycle”the harmonious development of the road,step bystep from “high extraction,low use,high-emission”into the status of “low extraction,high use,low-emission”model of development.For example,Wu’an Shimen mine park west not only improvedthe region due to mining environment pollution,and improve the land utilization,but also led thetertiary industry and regional tourism development,to some extent address the ecological needs ofself-Problem,effectively reducing the ecologicaldeficit.
3.3 The sustainable development of resources cityeconomic way
With the rising level of economic development,by significantly increasing the effective investmentin geological exploration,increase resource-basedback-up reserves of mineral resources in the city toimprove its sustainable development.This strategyimplementation approaches are:one is to imple-ment mineral resources geology exploration invest-ment system of diversity.Through the improvementof mining city investment environment,attract in-ternational mining capital,with developing explora-tion into new channels.In addition to the govern-ment investment,allow the private and foreign in-vestment in the exploration and development ofmineral resourcesSecond,encourage mining com-panies to enter the capital market through policysupport,such as equity or by issuing bonds to raisecapital to achieve sustainable development ofmining.The third is to establish intensive systemdevelopment and utilization of mineral resources,
mineral resources,economic development,reducethe use of strength.Through reform,reorganizationand transformation,establish a number of interna-tional competition ability of the big mining group toparticipate in the international competition,sharethe global resources results.Should be determinedto shut down those waste of resources,destroy theenvironment and security non-guaranteed smallmines.
Our country mining town of widespread industri-al structure of a single question,local economic reli-ance on mineral resources industry is very high.This depends on the resources the city is not con-ducive to the survival of long-term sustainable de-velopment.Mining city should be progressive reali-zation of economic restructuring in the develop-ment of mining industries,should focus on trainingand development of non-mining industries,andgradually improve the industrial structure,the di-versification of industrial structure.
3.4 The sustainable development of resources citysocial way
Resource-based cities are labor-intensive indus-tries,it is most concentrated areas of industrialworkers,and establish a sound social securitysystem is to maintain social stability in_re-source-based cities of the most important part.Pos-itive transfer of surplus production capacity,tostrengthen pre-service vocational training,helplaid-off unemployed people to employment and re-employment efforts to resolve enterprise resource ofhistorical issues,protection of resource depletionenterprises a smooth exit,so as to ensure socialstability and harmony.Resources have been deplet-ed or near the city people’s governments at all levelsto support the implementation of targeted policiesto help solve the depleted mines and economic re-cession caused by business failure,unemployment,workers outstanding contradictions and problems.The mineral resources are exhausted or endangeredthe dry the resource-based cities,people’s govern-ments at various levels shall targeted support andactively promote policy,help solve enterprise bank-ruptcy depleted mines logging caused by the reces-sion,worker unemployment such prominent con-tradictions and problems.
3.5 The sustainable development of resources citytechnology way
Resource-based cities is a typical feature of theindustrial structure of the deformed,the mostprominent is the low level of industrial structure,significantly higher proportion of secondary industry,the overall technological level,high energy con-sumption,product performance and low addedvalue,lack of market competitiveness.Their sus-tainable development and practical application ofadvanced technologies on the one hand should theresources to transform the industry,so that re-sources transferred to the development of the in-dustry came to rely on scientific and technologicalprogress,improve product structure and industrialstructure of the hierarchy,and the optimization andupgrading,improving the resource industry’s modeof operation Resource industries to promotehigh-quality,high yield,efficient,clean,safe andcomprehensive utilization patterns;On the otherhand have to rely on science and technology,train-ing and development of new industries,improvingthe resource-based cities of the industrial struc-ture,and gradually rationalize the industrial struc-ture.The choice of the innovation model can chooseto imitate innovation,cooperation and innovation,innovation,flexibility in the choice of innovative ap-proaches,practical.
References
[1]Wackernagel M.Way sustainability analysesmust include biophysical assessments [J].Econ-nmics,1999(29):13-15.
[2]Wackernagel M,Onisto,BellP eta.1 National na-tureal capital accounting with the ecologyical foot-prin t comcept[J].Ecolodicala E connm ics[J(.1999(29):75-390.[3]Mathis,Wackernagel,Onisto,BelloP,Linare-sAC,etal,Ecologyical Footprint of Nation:Howmuch nature do they use?How mu ch nature dothey have?[M ].CostaRica:The Earth Counci,l1997.
[4]Yang kaizhong,Yang yong.Ecological footprintanalysis theory and method[J].Earth science prog-ress,2000(6):630~636.
[5]Li lifeng,Cheng shengkui.Ecological footprint ofsustainable development of new indicators to mea-sure[J].Journal of natural resources.2000(4 ):375~382.
[6]ZHANG ZHI-QIANG,XU ZHONG-MIN,CHENGGUO-DONG.The concept of ecological footprints’and computer models[J].Ecological Eonomics,2000,(10):8-10.
[7]TAO ZAI-PU.Eco-rucksack and eco-footprint:the conception of weight and area of sustainabilitydevelopment[M].Beijing:Economic Science Press,2003,11:161,169.